🔗 Visualize in Tableau 👩💻 Source Code
Description
End to end data analyst project from gathering data programatically using the Kaggle API, through data exploration, assessment and manipulation using the pandas library in Python, to data visualization in Tableau.
Data Acquisition
The data collected from kaggle London bike sharing dataset.
Data Preparation
- Data downloaded programatically through API of kaggle using python.
- Data manipulation used for -
- specifying new column name
- making humidity percent value
- mapping weather and season name
- casting data types
- Saving the final data in excel format.
Data manipulation process completed with Pandas.
Data Analytics
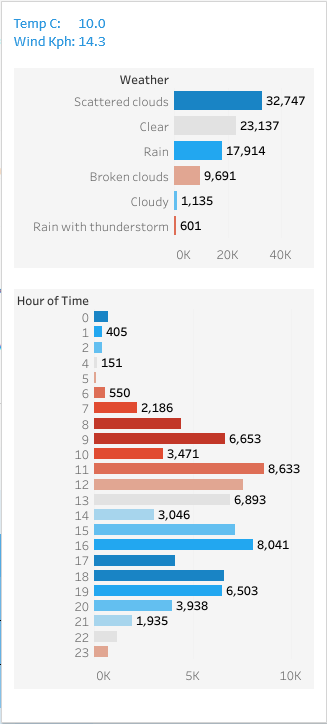
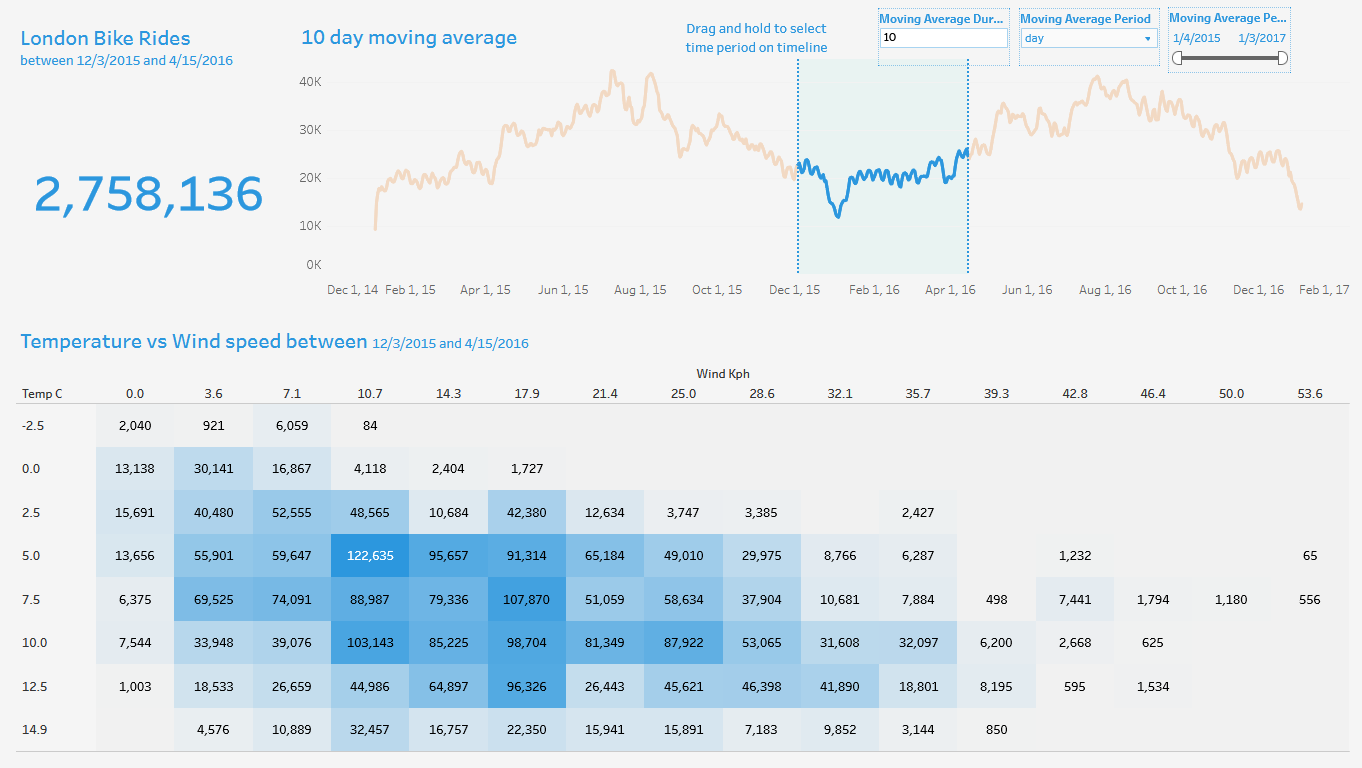
The data anlytics and visualization completed using Tableau. The moving average rides visualizatioon, wind speed and temperature heatmap is presented in the visualization where weather and hour of time visualized in tooltip.
Full Visualization
Tooltip Visualization